Data from the last 12 months of data on the Baselayer platform
We Monitor Millions of Businesses Every Month. Here Is What We Found.
Baselayer monitors millions of businesses as they move through the onboarding flows of more than 2,300 lenders, fintechs, banks and payments companies in America. This report is a brief look at what we found in the businesses we monitored for our customers over the last 12 months.

Who is being onboarded
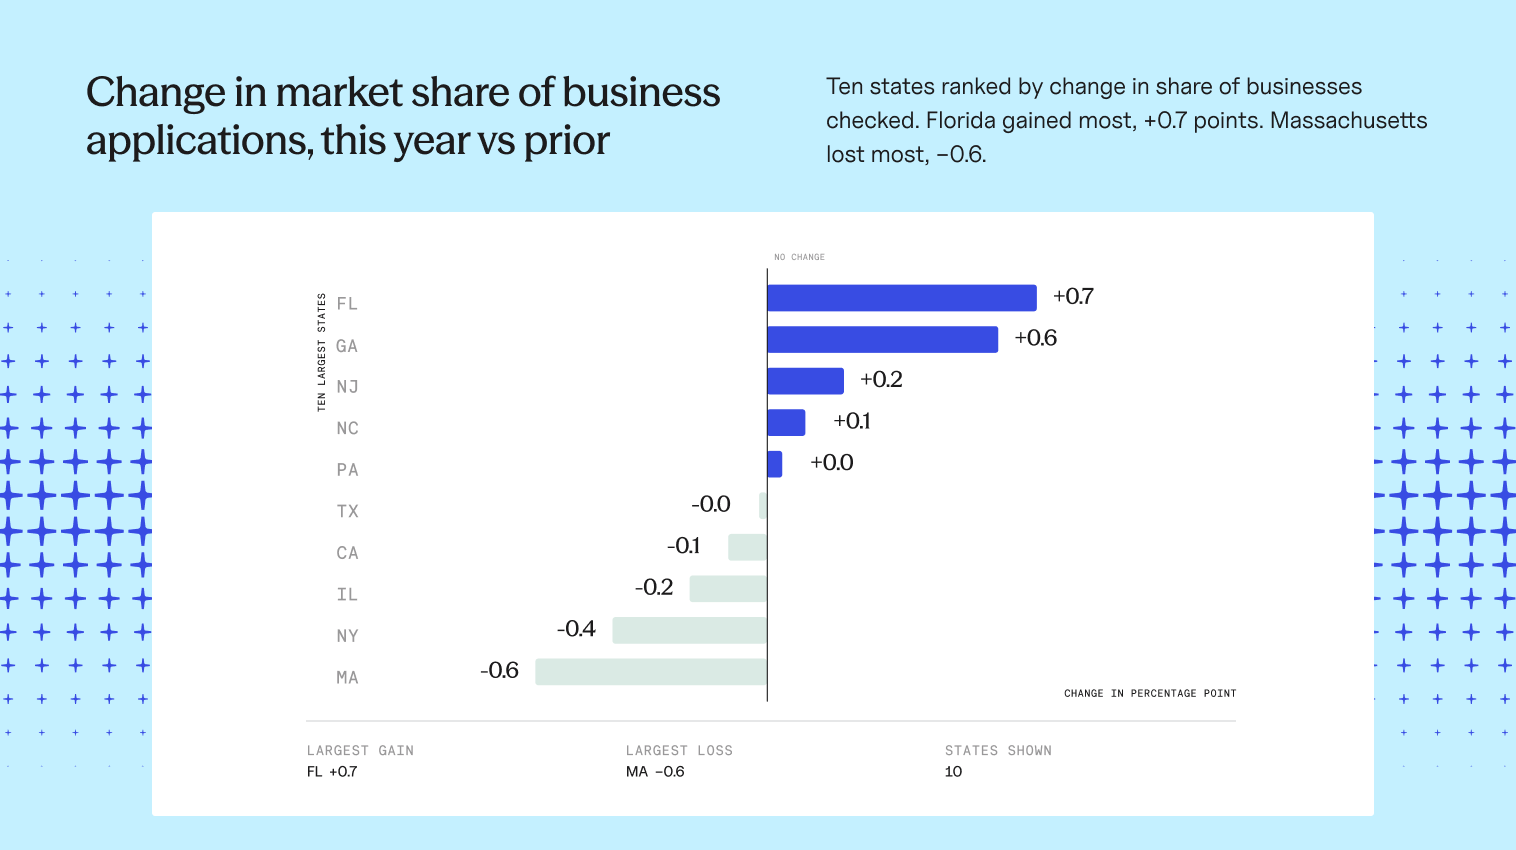
Lending demand moved toward Florida and Georgia. It moved away from the Northeast and California.
Florida and Georgia picked up the most share this year. Massachusetts, New York and California gave up the most. California and Texas are still the two biggest states, at about one in ten businesses each.
What monitoring shows you here
Florida and Georgia have been pulling in small businesses for years, helped by Florida’s lack of a state income tax and lower operating costs across the Southeast. Whatever the cause, your applicant pool is shifting, and it shows up in applications long before it shows up in a portfolio review. Every state runs its own rules for standing, liens and annual reports, so a book that drifts into new states picks up risks the original checks were never built to catch. Monitoring keeps up with the business wherever it goes.
Standing
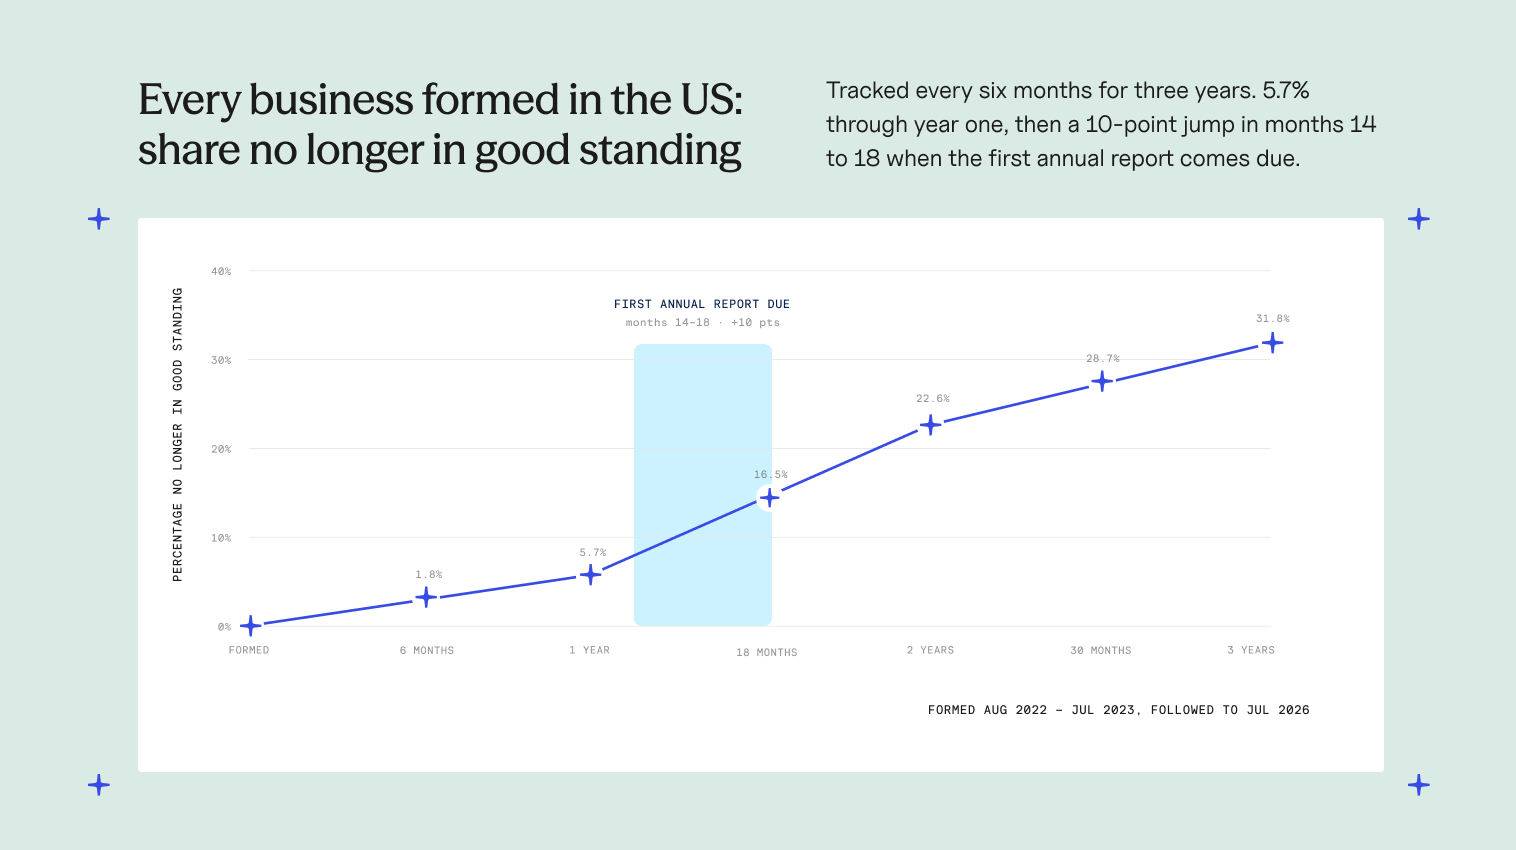
16% of businesses lose good standing within 18 months. By year three, it is a third.
We followed every business formed in the US through its Secretary of State record. 6% had lost good standing within a year. 23% by the end of year two. 32% by year three. Almost all of the year-two jump lands in months 14 to 18, when the first annual report comes due and states start dissolving the businesses that missed it.
What monitoring shows you here
Standing is one of the cheapest signals in commercial credit, and one of the least re-checked. Most of the loss on this curve lands between months 14 and 18, after you onboarded the business and on the state’s filing calendar rather than yours. A one-time check catches the businesses that were already gone. Monitoring catches the ones that go afterward.
Stacking
1 in 6 applicants already have a lender. They are the ones most likely to take another.
When a business applies for a loan, we look for consensual UCC liens already filed against it before the application date. The ones with a lien already on file went on to take another lender nearly three times as often as the ones with none.
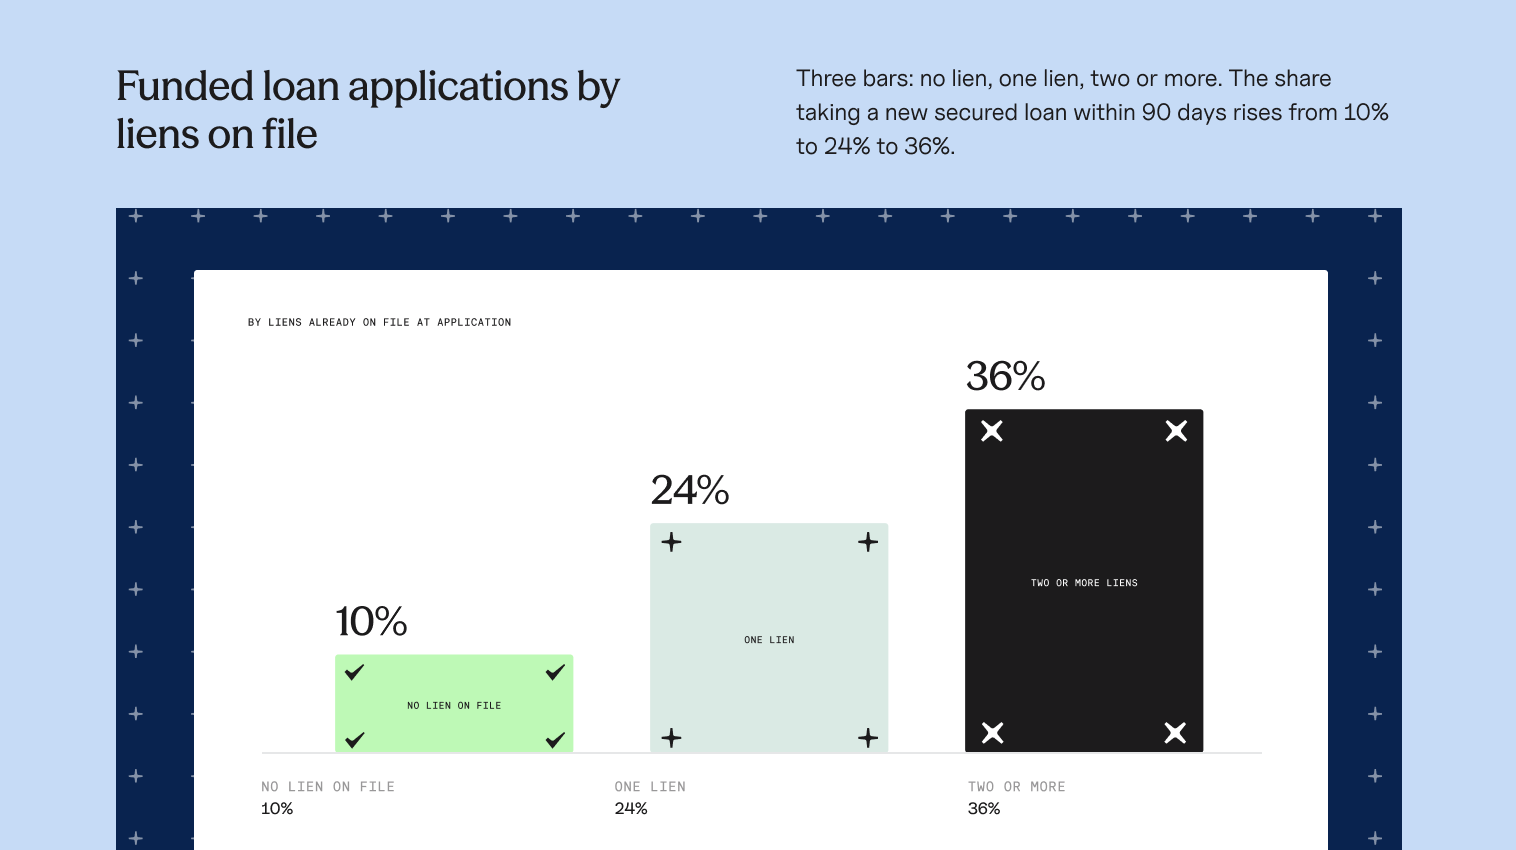
13% of loan applicants were successfully funded with a secured loan within 90 days. For first-time borrowers it was 10%. For applicants who already had a lender it was 28%, and it climbs with every lien on file. The average hides the split. The businesses already carrying credit are the ones adding more.
What monitoring shows you here
A borrower’s odds of stacking are not fixed on the day you fund them. With no lien on file, only 10% of the applicants take on their first loan. For existing borrowers with one lien, 24% sign. With two or more, 36%. Every new lien on a business you have funded moves it up a bracket. Lenders on Baselayer see that move the day it happens, not weeks later when the filing lands.
Speed
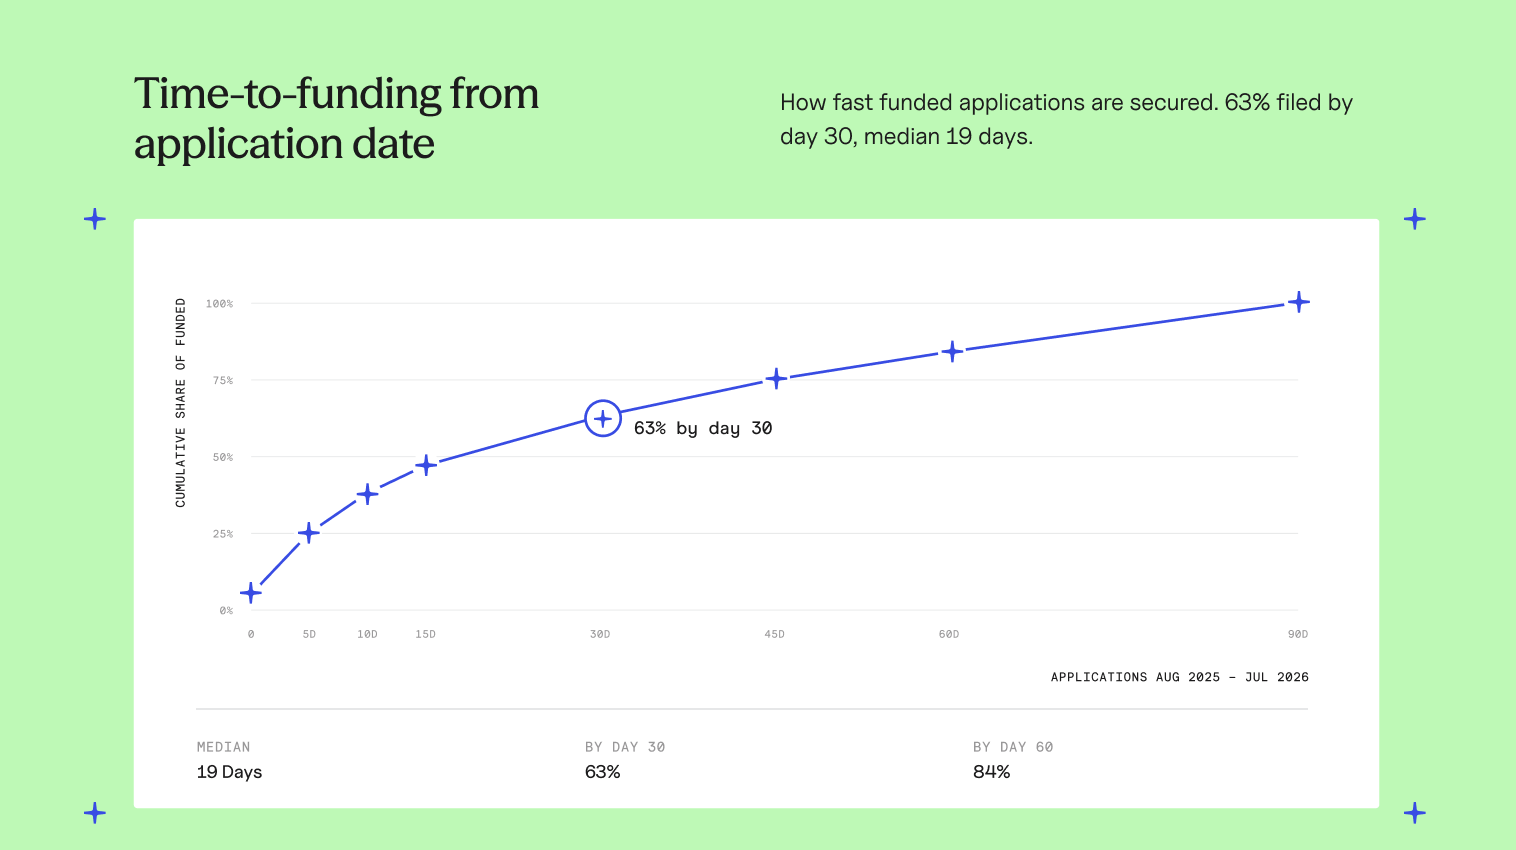
Liens tell you about a new loan 19 days after the application does.
Lenders using Baselayer see what their customers are doing in real time. Rely on UCC records alone and you react up to a month after your customer has started shopping for alternatives. For funded loan applications, the median gap between the application and the filing was 19 days.
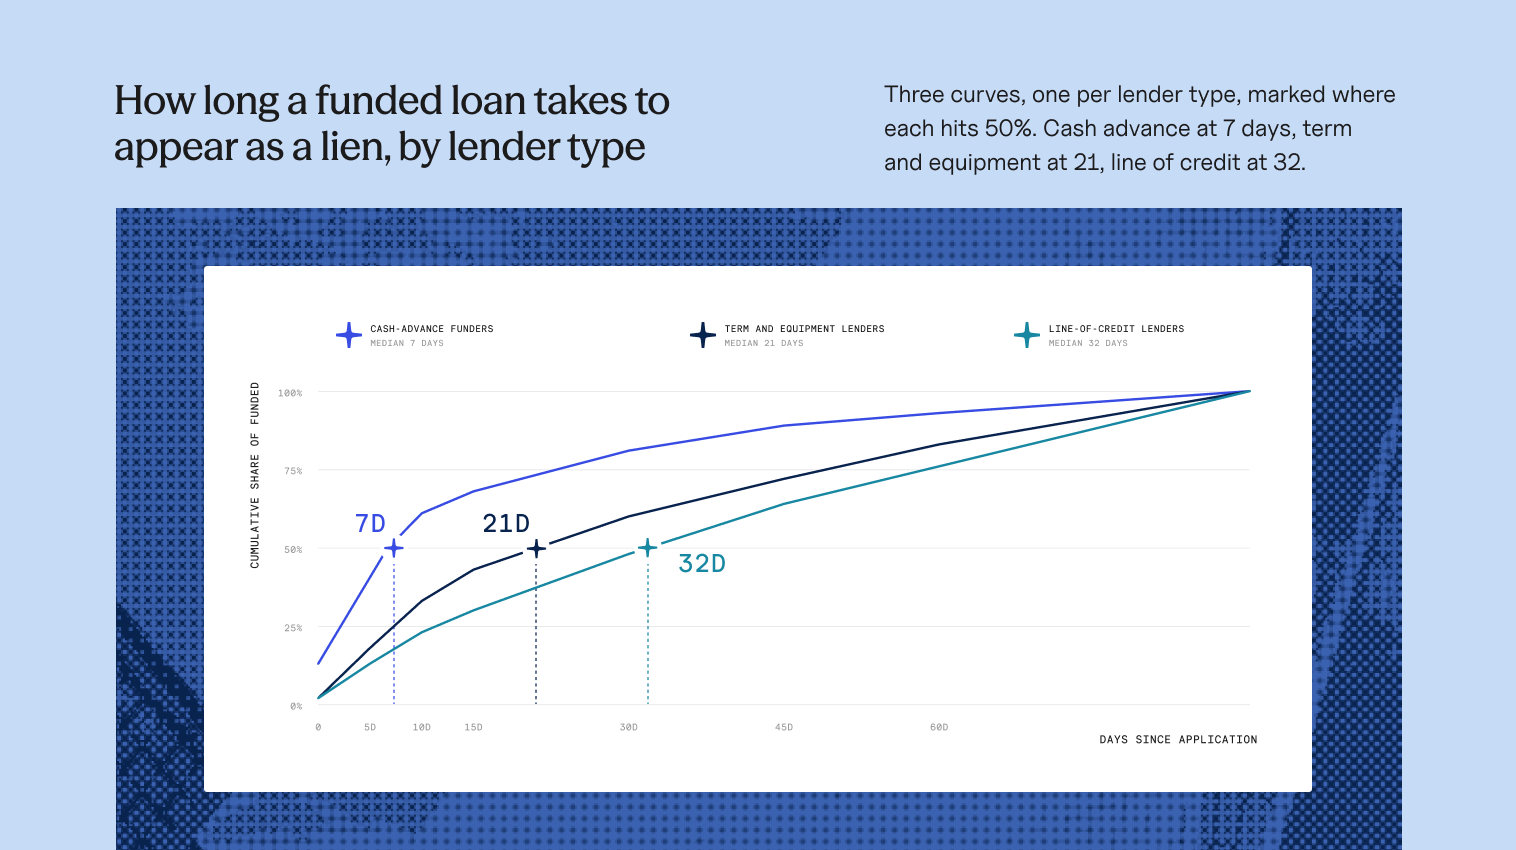
Merchant-cash-advance funders move fast.
Of the cash-advance loans that reach the public record, 60% are on file within 10 days of the application, and half within a week. Term and equipment lenders take about three weeks to show up. Line-of-credit lenders take about a month. The same business, funded by two lenders on the same day, leaves two very different trails, and if you watch liens alone you see one of them weeks after the other.
What monitoring shows you here
If you only monitor liens, you are about 19 days behind. That is the median gap between the day a borrower applies elsewhere and the day the lien is filed, and for many loans the lien never shows up at all. Baselayer customers see their borrowers’ activity in real time, the day an application happens. That is how you step in before the stack forms, and before another lender buys you out.
What this means for your portfolio
Get ahead of the curve.
6% of businesses lose good standing in their first year. Another 10 points drop out in months 14 to 18, when the first annual report comes due, well after you onboarded them. By year three, it is a third.
One applicant in six already has a secured lender. Without a robust monitoring process, those borrowers stack nearly three times as often as first-time borrowers.
Relying on filed liens tells you about a new loan 19 days after the application happened, and even later depending on the type of lending product the customer is looking for.
Baselayer Portfolio Monitoring
Risk moves fast. Move faster.
Portfolio Monitoring watches every business you onboard against the same registries, risk and network signals this brief is built on, and tells you in real time when anything changes. Get ahead of the curve by using Baselayer’s most powerful product.
Method
Business verification requests by organizations on the Baselayer network, Aug 2025 – Jul 2026, with Aug 2024 – Jul 2025 as the comparison year where one is shown. Secretary of State registrations and consensual UCC filings from all fifty states were used in this analysis.
Standing figures follow every registration filed in the formation window through its state record; a business counts as having lost standing when the state records a dissolution, revocation or delinquency date; months since formation are calendar-month differences between the filing month and the inactive-date month.
A lien is a consensual UCC filing naming the business as debtor; “funded application” means a lien within 90 days of the business verification request.
Lender types (cash advance, term and equipment, line of credit) are Baselayer’s classification of those organizations.
All figures are shares and rates; the network grew significantly during the period, so year-over-year comparisons describe what became visible, not market volume.